Continuous
INNOVATORS
Trusted
COLLABORATORS
Determined
PROBLEM SOLVERS

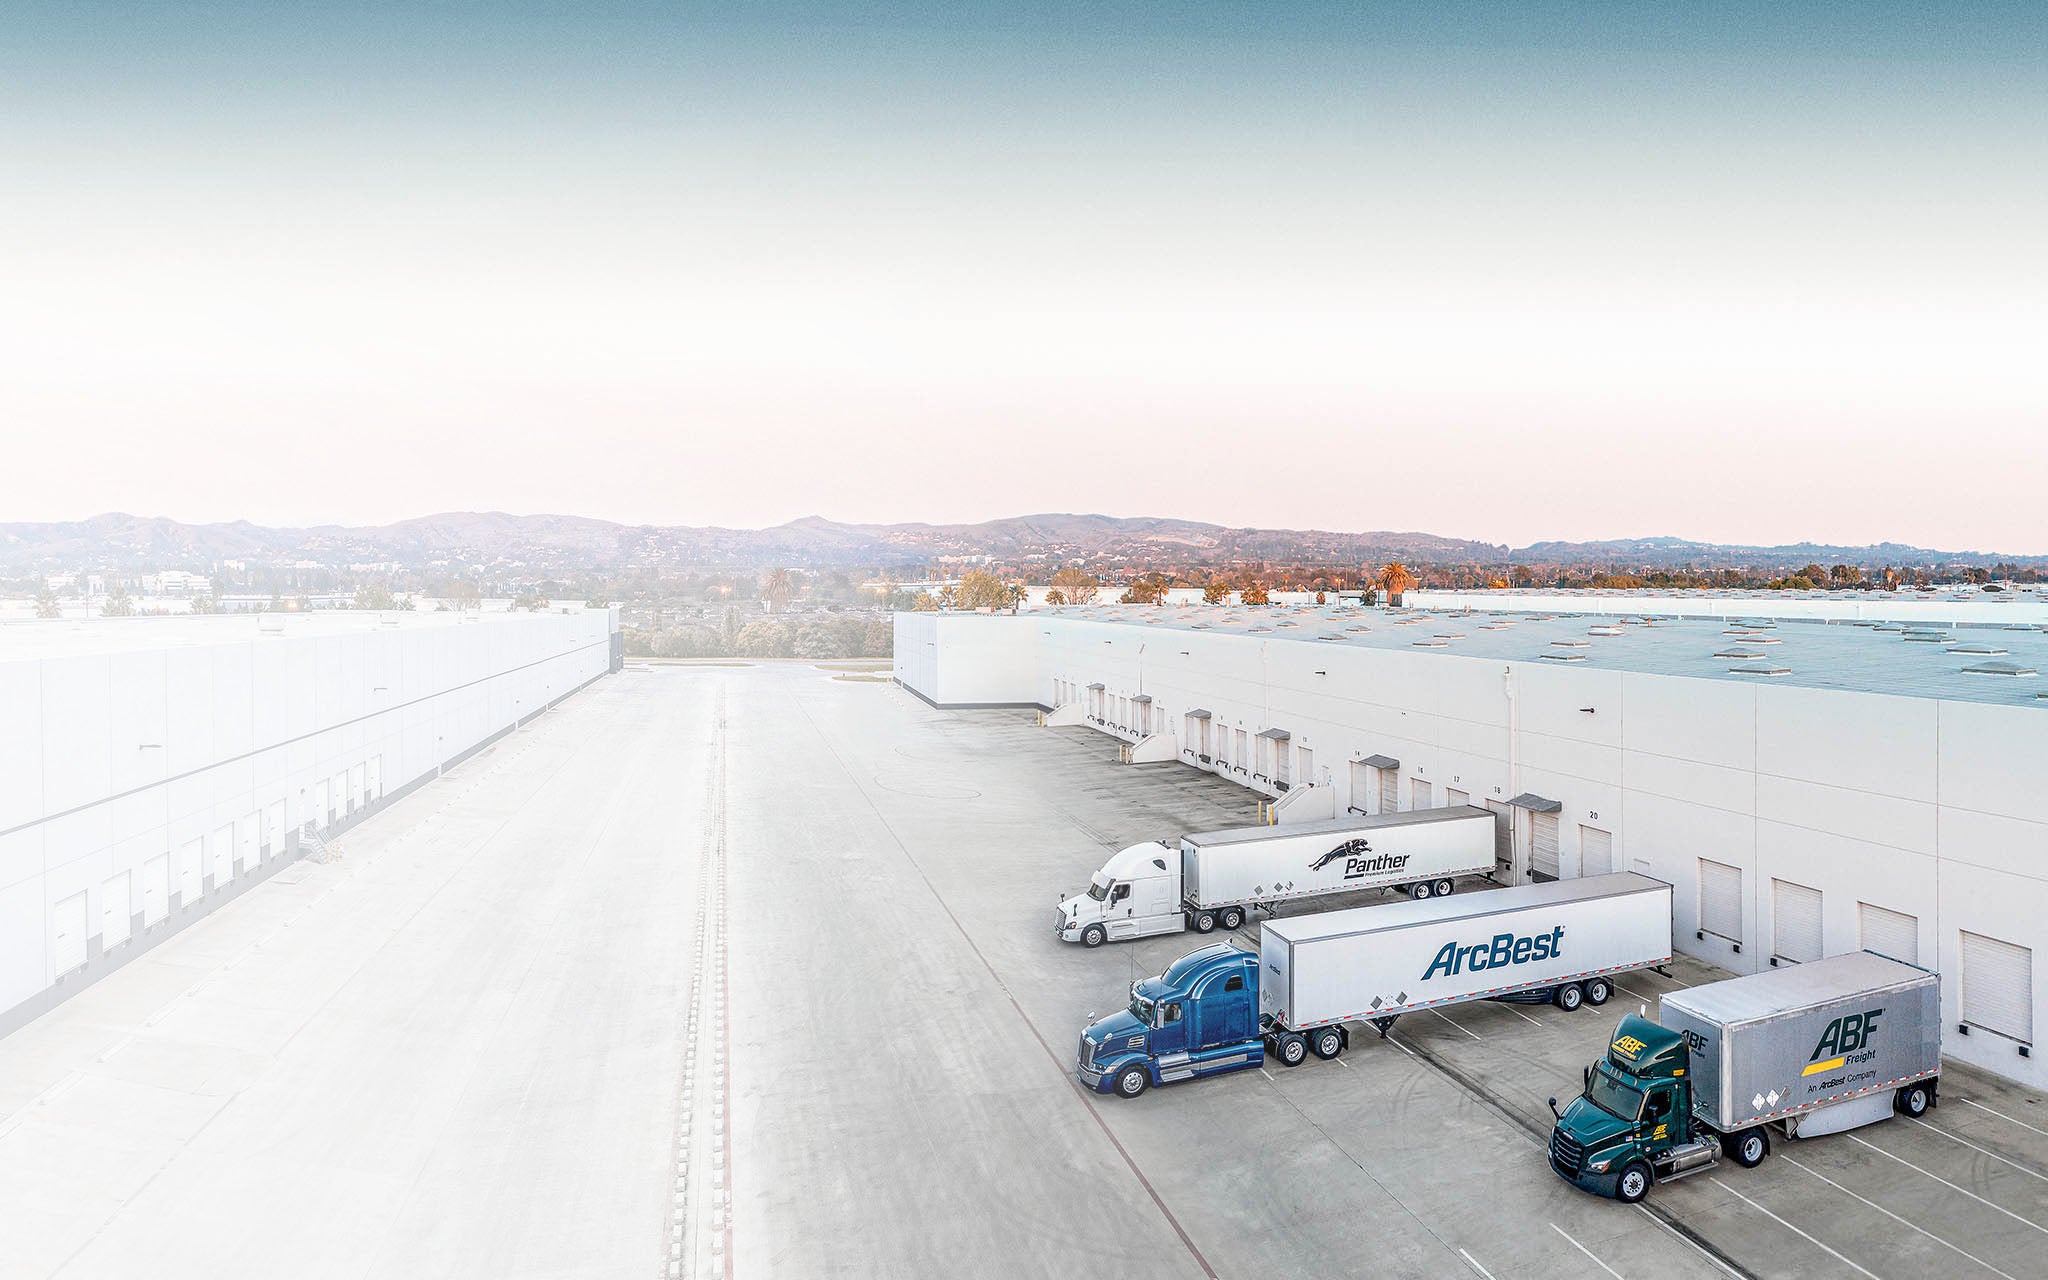
The ArcBest story
is simple:
We create smart supply chain solutions
for companies across all industries
by leveraging our leading-edge technology
and growing network of drivers & carriers
to move shipments around the world
while providing exceptional customer support
Get started
with ArcBest:
Quick Access to Our Most Popular Tools
Shipment Tracking
View live updates to monitor the status of your freight during transport. Quickly check on your shipment 24 hours a day with our simplified tracking tool.